Showing posts with label LLM. Show all posts

Saturday, November 16, 2024

Wherein We Crack Yet Another Program And Learn Something In the Process: part three (or something)


So, let's fast-forward through this first part. While it was revealing, it wasn’t all that great. Informative? Sure. Exciting? Nah.

So we can skip the fluff.


There I was, creating yet another C program to crack—asking an LLM (Large Language Model) to be rough with me. I told it to place whatever protections it found amusing, especially ones that might put a damper on my usual GDB shenanigans.

I whipped up a simple C program with some XOR gimmicks and handed it over to the LLM, telling it, “Go nuts. Protect this binary as if your life depends on it.”(I might be paraphrasing here).

The LLM's Attempt at a Challenge

Well, the LLM tried, but it failed pretty hard. Not because I’m some kind of binary-reversing wizard (I’m not), but because its defenses mostly relied on surface-level userspace tricks. These are the kinds of protections that look flashy but crumble under the weight of a determined debugger wielding carefully placed breakpoints.

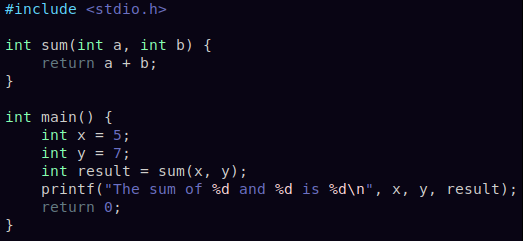
Let’s cut to the chase: here’s a snippet of the original code it generated:


Breaking the "Protections"

Most of these defenses—fake functions, misleading execution flows, or basic obfuscation (not all seen here)—can be easily defeated with a debugger. When you examine the binary at runtime, these kinds of tricks are more like a speed bump than a roadblock.

GDB was enough by itself to detect the two main weaknesses—key+encrypted password:


And voilĂ , a quick peek into those memory locations reveals the key and the encrypted password. Nothing we haven’t seen before:


The logic here is straightforward. By reading the ASM, we can tell there’s a xor operation happening, and the key is being repeated (via a modulo 4 operation) to match the encrypted password’s length (10 characters).

Great! From here, undoing the operation is trivial. A simple Python script does the trick:


And that’s it. We have the password, the binary is cracked, and we move on.

Lessons Learned

What’s the moral of this part? Don’t store your bloody password and key inside your binary. Ever. Seriously, it’s like leaving your house key under the mat and hoping no one checks.


This reminds me of that guy who stored his password inside his binary while working on a GitHub project with full version control. He was surprised to find others knew the pass, regardless. 


What's Next?

I could create more complex C programs where the password lives elsewhere (maybe a server, maybe environment variables), but honestly, that defeats the purpose of this kind of exercise. Plus, it opens up a whole other can of worms I don’t feel like opening just yet.

Instead, we’ll dive into Binary Security: NX, ASLR, RELRO, Stack Canaries, and how these mitigations shape the reverse-engineering landscape.

It’ll be fun (or your money back—promise).


Sunday, September 8, 2024

Wherein We Get Lost And Compare Object Dumps: C vs. Assembly


That's a rabbit hole, Alice. And those are books on shelves, all the way down.


Hi again!

I created a simple "Hello, World!" program in C, so that we could have a quick talk about function prologues and epilogues in Assembly, but we're in for a detour, as happens with all rabbit holes. 

And the truth is that it's just rabbit holes as we're going down (until we reach elephants, and then it's turtles all the way down, of course).

Here's the culprit:

Ok, nothing impressive, but it does its job.


After compiling this program through the usual steps, the program runs and prints "Hello, World!" to the standard output.

Next, I wanted to create an Assembly program that would print the exact same line, and although I can read some Assembly and am making progress in that front, I can't (yet) write my own Assembly programs. So I asked our LLM friend to do it for us. And so it did:


Pretty neat.

And we can turn this into a binary file with:
nasm -f elf32 print_hello_ASM.asm -o print_hello_ASM.o


And then turn it into an actual program with:
ld -m elf_i386 print_hello_ASM.o -o print_hello_ASM

And voila! We can run this program just like with our C program...

But...

 "wait, wait, wait, wait!"
You say.

"What's with the turning-the-code-into-binary-and-then-into-a-program-magic?

We don't need to compile stuff in Assembly, like we do with C?"

Well, those are great questions!

The thing is that we take compilation for granted. In fact, compilation is done in 4 steps:

- Preprocessing

- Compilation

- Assembling

- Linking

Let's ask an LLM to give us a little more information on these steps, and let it assume we want it explained in a simple manner:


Confused? Remember that you can always ask it to explain again from a different angle, in simpler terms, through analogy, etc:


We can always check more trustworthy sources, check documentation, forums, etc, like in:
https://unstop.com/blog/compilation-in-c

(I told you, it's rabbit holes most of the way down)


I'm not going to give you an in-depth explanation of these concepts (that's your job, really). But let's just say for the sake of simplicity, that when we compile our C code, we're in fact going through these four steps, and that when turning our Assembly code into a program, we just take the two last steps: Assembling and Linking (also, fyi: note that these steps can be combined or optimized in modern compilers).


To showcase the difference between these two processes and the baggage that comes along with C, let's look at an objdump of both our C and our Assembly programs.

What's an objdump? Here:


So... it's basically when we take a binary file and disassemble it back into Assembly code (+ extra info).


Then let's jump into that Assembly objdump of ours, right? Here:


And, for comparison, here's a gif with the C objdump:


Notice any difference? The C objdump file is a tad longer.
And note that I haven't included all the possible information in these dumps (checkout the man page for objdump. In particular for the -s argument).


Notice, though, that there is something we haven't seen before in our little Assembly forays. In that ASM objdump, we see these "int   0x80" lines. What are these?
Seems important enough.

These are system call interrupts, which are a way for our program to request services from the operating system's kernel. Namely, we want to be able to print our Hello World message on screen and we also want to be able to exit our program - that's what those two syscalls are doing there.

This is done behind the scenes through compilation when we're using C - so it's not all that obvious to us.


More info from our friendly LLMs:


Ah, but I just recalled that we were meant to discuss function prologues and epilogues in Assembly.

I went to https://godbolt.org/ and placed my original C code in there, and immediately got an Assembly representation of that code as well. 

And lo and behold, it's even color-coded, allowing us to see exactly what is the prologue and what is the epilogue.

Here:


But I'm leaving function prologues and epilogues for an upcoming blog post.


In the meanwhile, you can always check that yourself if you're curious. Or anything, really. See something you don't understand? Leave no stone unturned! Jump into that hole, satiate your curiosity and keep learning.


Wednesday, September 4, 2024

Wherein We Discover Some C Code: With A Little Help From Our Friends


 For the past year, while studying networking and programming in ATEC, I kept ChatGPT constantly open—not to give me direct answers, but to engage in a kind of "learning dialogue," let's say. It was there to challenge my understanding of the topics I was learning and to quickly fill in knowledge gaps that came along.

Was I skeptical of its knowledge? Of course. The same way I’m skeptical about any single source of information—take Wikipedia, for example. When it first came out, it was vilified by many for its crowdsourced approach to knowledge. But, hey! We still use it to this day. It’s a great tool, right?


Step 1: Generate and Compile the C Code

Continuing from our previous blog entry, let’s once again use ChatGPT to help us learn a bit more about Assembly and low-level code.

Today, we’re asking ChatGPT to give us a simple C snippet, which we promise not to read. We’ll copy and paste it into a document and compile that document into a binary, which we will then disassemble and try to understand.

Sounds fun? Let’s go!

See that? No peeking. Just copy that code, paste it, and save the script so we can compile it.

Our ask was simple: no recursion (no need to add an extra layer of complexity), only one function, etc (you can read it for yourself).

Copy-paste that sucker into an empty file, and that's it!
You didn't peek. You have no idea what's in that file. The world still makes sense.

If you are a "dirty cheater", just ask a friend to send you something very simple. Hey, it's a great way to make friends. True friends know C.

Next, you'll want to compile that code without debugging symbols. You might need to install the necessary multi-lib support:

sudo apt-get install gcc-multilib g++-multilib

"Oh, but I'm using Red Hat/Arch (btw)/etc, how do I get that package installed?"

Well, just ask ChatGPT. That's what it's there for. Or Google it, or something.

Let us (finally) compile that code:

gcc -m32 -o my_file my_file.c

I'm going to compile a second version with debugging symbols, by adding -g (remember?). More on this later.

Step 2: Disassemble and Explore the Assembly Code

Now we jump into gdb, like we did last time, but with a small twist: we'll be checking out TUI - the Text User Interface, by typing:

(gdb) layout asm


I might be biased, but this looks totally cool.


I'm not going to go deeply into the function prologue and epilogue (I'll leave that for another blog entry). Right now we're just interested in the "meat" of the program. What is it actually doing?

Notice that, right before the call line where we're calling a function named compute we're actually loading the value 4 and pushing that onto the stack?

That value is being loaded into the function as an argument.

That's useful to know!

And here it is, the compute function in all it's glory:


Again, we'll skip all the setup and concentrate on the "actions".

Look at that add. We're taking eax, which you might have noticed is now holding the value 4, and adding to itself, literally doubling that value. And we have another addition further on. We're adding 5 to that value, right before leaving our function and returning to main.

Let's cut this story short.

If you look at main, you'll see that our function will then print the result and end the program.

Like I said: we'll get to the tasty bits another day, but I wanted you to have a view of what we can do with this stuff. How we can use ChatGPT to create simple challenges which we can then work on. Remember: don't know something? Ask it what it means. Ask it to explain from a different angle. Ask it to draw you a picture - literally.


Step 3: Create your own C version of that disassembled code

Let's do it. We're not trying to be perfect here. Only to grasp the idea behind the assembly code and create a C program that could achieve a similar result. And here it is:


Is this perfect? Nah. Far from it. But it gets the gist of what that Assembly code is doing. And that's good enough for now.


Step 4: Now even more TUI

Remember when I said that I was going to create an extra compiled version of the original code? One that kept the debugging symbols.

Let's open that file in gdb, and after we've entered TUI, we'll also write:

Would you look at that? Because we added debugging symbols to our compiled code, we can now use TUI to read both the disassembled code and the original C code. How cool is that?

Oh, right. Notice that the original code doesn't have result+= result? Again, details.

For now, we're pretty satisfied with the result we got.

Next time, we'll be checking another really cool tool—one that is online and that doesn't require any installation or compilation. You just present the code, and it will return you corresponding assembly output.

I hope this was informative and gave you some ideas on how to use an LLM in your learning process. It can help you achieve these small goals competently and in an expedite manner.


Happy disassembling!


Sunday, September 1, 2024

Wherein We GDB Debug: While Talking To Claude


Today's idea: use an LLM to generate simple code that we can disassemble, debug, and then have that same LLM answer some simple questions that we might have about the code.


So, here we are, asking Claude LLM to provide a very simple C program so that we can compile it and debug it with gdb.

Here's the code:


Compilation:

gcc -g simple_file.c -o simple_file

The -g flag adds debugging information to the compiled program

Run the debugger:


gdb simple_file

While inside the gdb debugger, we set a break point at the main() function:


Running the code:

(gdb) run

Set the flavor to intel:

(gdb) set disassembly-flavor intel

Checked the disassembled code:


Executing instructions one at a time:

(gdb) si

The si command steps through each machine instruction, allowing us to see the precise execution flow and understand how registers and memory are manipulated.

We can see the current values with, for example:

(gdb) print x

We can also check all local variables that are in scope at the current point in the program (in the current stack frame), with:


We have values of 0 or even nonsensical values, because they haven't been attributed just yet.

The output of disassemble main doesn't map one-to-one with the source lines. This discrepancy occurs due to compiler optimizations and the difference between the layout of low-level machine instructions and high-level code structure:


Also, around this time (look for the => if in doubt), we're dealing with four different registers: EDX, EAX, ESI, and EDI.
 
In x86_64 architectures (Linux and most Unix-like systems) the first six integer or pointer arguments to a function are passed in registers, not on the stack, and they are used in this order:

RDI, RSI, RDX, RCX, R8, R9.

In this case, we're only using the first two (our sum function only takes two arguments).

EDX and EAX load the values from memory, and then these values are moved to ESI and EDI, which are the lower 32 bits of RSI and RDI, respectively.

Also, if you're wondering what are those values between the less than and greater than signs, they represent the offset in bytes from the beginning of the function. So <+26> means that this particular instruction is 26 bytes away from the start of the main function.

Let's get current information on two of the aforementioned registers:


And so on...

We can go line by line, question an LLM on simple stuff like this, or go to specific sites for more detailed information, read a book, watch a few tutorials and explanations, etc.

No, really! Ask it questions. Don't understand something? Ask to explain again, to try a different angle, etc.


Want to check this code in 32-bits assembly?

When compiling, use the following line, instead:


gcc -m32 -g simple_file.c -o simple_file


Peel away at these layers and keep on learning!


"INTs Aren't Integers and FLOATs aren't Real"

                                     I was told this is a cat-submarine. Tail = Periscope. I believe it.   Over the past few weeks, I’ve be...