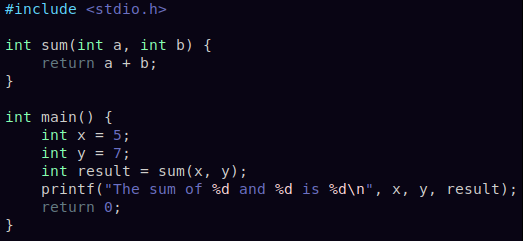
So, here we are, asking Claude LLM to provide a very simple C program so that we can compile it and debug it with
gdb.Here's the code:
Compilation:
gcc -g simple_file.c -o simple_file
The -g flag adds debugging information to the compiled program
Run the debugger:
gdb simple_file
While inside the gdb debugger, we set a break point at the main() function:

Running the code:
(gdb) run
Set the flavor to intel:
(gdb) set disassembly-flavor intel
Checked the disassembled code:

Executing instructions one at a time:
(gdb) si
The
si command steps through each machine instruction, allowing us to see the precise execution flow and understand how registers and memory are manipulated.We can see the current values with, for example:
(gdb) print x
We can also check all local variables that are in scope at the current point in the program (in the current stack frame), with:

The output of
disassemble main doesn't map one-to-one with the source lines. This discrepancy occurs due to compiler optimizations and the difference between the layout of low-level machine instructions and high-level code structure:
Also, around this time (look for the
=> if in doubt), we're dealing with four different registers: EDX, EAX, ESI, and EDI.In x86_64 architectures (Linux and most Unix-like systems) the first six integer or pointer arguments to a function are passed in registers, not on the stack, and they are used in this order:
RDI, RSI, RDX, RCX, R8, R9.
In this case, we're only using the first two (our sum function only takes two arguments).
EDX and EAX load the values from memory, and then these values are moved to ESI and EDI, which are the lower 32 bits of RSI and RDI, respectively.
Also, if you're wondering what are those values between the less than and greater than signs, they represent the offset in bytes from the beginning of the function. So <+26> means that this particular instruction is 26 bytes away from the start of the main function.
Let's get current information on two of the aforementioned registers:

And so on...
We can go line by line, question an LLM on simple stuff like this, or go to specific sites for more detailed information, read a book, watch a few tutorials and explanations, etc.
No, really! Ask it questions. Don't understand something? Ask to explain again, to try a different angle, etc.
Want to check this code in 32-bits assembly?
When compiling, use the following line, instead:
gcc -m32 -g simple_file.c -o simple_file
Peel away at these layers and keep on learning!


No comments:
Post a Comment