Showing posts with label C. Show all posts

Sunday, December 22, 2024

Wherein We Look At An ELF: Executable and Linkable Format


                So, this is an ELF file, huh?


Elves

For the past few days, I've been delving into ELF (Executable and Linkable Format) binaries—specifically focusing on their structure, behavior, and ways to manipulate them. If the subject matter is of any interest to you, then check this out.

What are ELF files?

They are a "common standard file format for executable files, object code, shared libraries, and core dumps, at least according to Wikipedia.
The magic number for ELF files is 0x7f 45 4C 46. Care to guess what's 45 4C and 46 in ASCII?

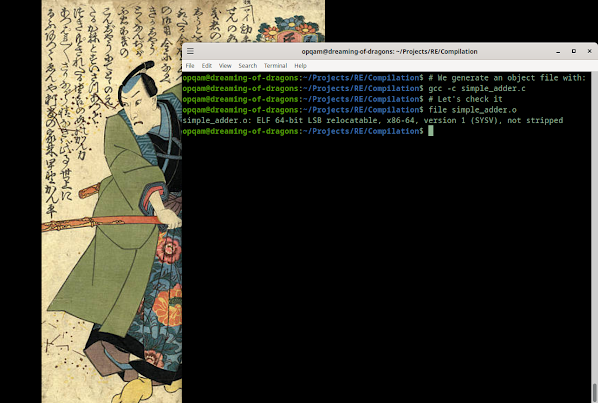
Let's look at (yet another) terribly simple C script and then look under the covers:


Not terribly impressive, but we're not trying to be terrible or to impress anyone.

Remember when we talked a bit about the 4-step compilation process here? Instead of directly compiling this program, let's jump to the Assembly phase and look at the object file:


So, as we can see, we have a 64-bit ELF object file... relocatable. What does it mean for this to be relocatable?
It means that it's not dependent on specific memory addresses. So this file can be moved around without breaking its code. Our code isn't yet an executable. We're still short of that objective since we've not yet passed through the linking phase, which will or might add to it other object files or libraries, and then yes, produce our executable.

Remember that, for the most part, programmers skip and don't even think about these steps. The compilation process takes care of all of this in the background, and only if something is untoward will the programmer be warned that one of these 4 steps went awry.
And notice as well that this file is 'not stripped'. What's this, you ask? It's informing us that the the file contains the symbol table and debugging information within it. This keeps information that is useful for debugging purposes, making it easier to analyze and understand what's happening, with tools like gdb or objdump. On the other hand, stripping our binary means that both symbol table and debugging info will be removed. The symbol table contains the names of functions, files, variables and other metadata useful for debugging or reverse engineering. And that extra debugging info shows the variable types and line numbers, for example.
So, stripping will reduce the file size, hide implementation details but also make debugging a bit harder.

Under the hood

Let's do it. It's pretty simple, actually. After finally creating our binary, we can strip it with:
strip --strip-all simple_adder

Here we can see the difference between the two files, through the use of the command readelf:


It's a bit rough around the edges, but if you look carefully, you can see two files, one stripped and one not stripped, and the difference is telling, even for such a small binary.
Obviously, stripping is also used as a countermeasure and obfuscation technique.

The readelf command that you see up there is a tool for analyzing and displaying information about ELF files. With it, we can inspect the internal structure of ELF files, such as executables, shared libraries, or object files. Yes, it's what that ELF lady is doing at the beginning of this blog post. I know. Genius.

Readelf comes in handy to debug linking issues or to understand how an executable or a library is laid out.
As per usual, man files are your friend here.


.text, .data, .bss and .rodata

Elf files have critical areas, like .text which contains executable instructions, .data which stores initialized global variables, .bss which holds uninitialized global variables and .rodata, which holds read-only data, such as constant strings.

We can inspect the .text section, which could be considered as the heart of the program (holding the executable code, really), with a tool like radare2 or objdump, for example:


As you can see, this is giving us Assembly code (in AT&T, no less... yuck) revealing function prologues, loops, and system calls.
Of course, recognizing these patterns is a vital skill for the Reverse Engineer.

Try this for yourself. Also remember to check .data and .bss with:
readelf -x .data your_file
readelf -x .bss your_file

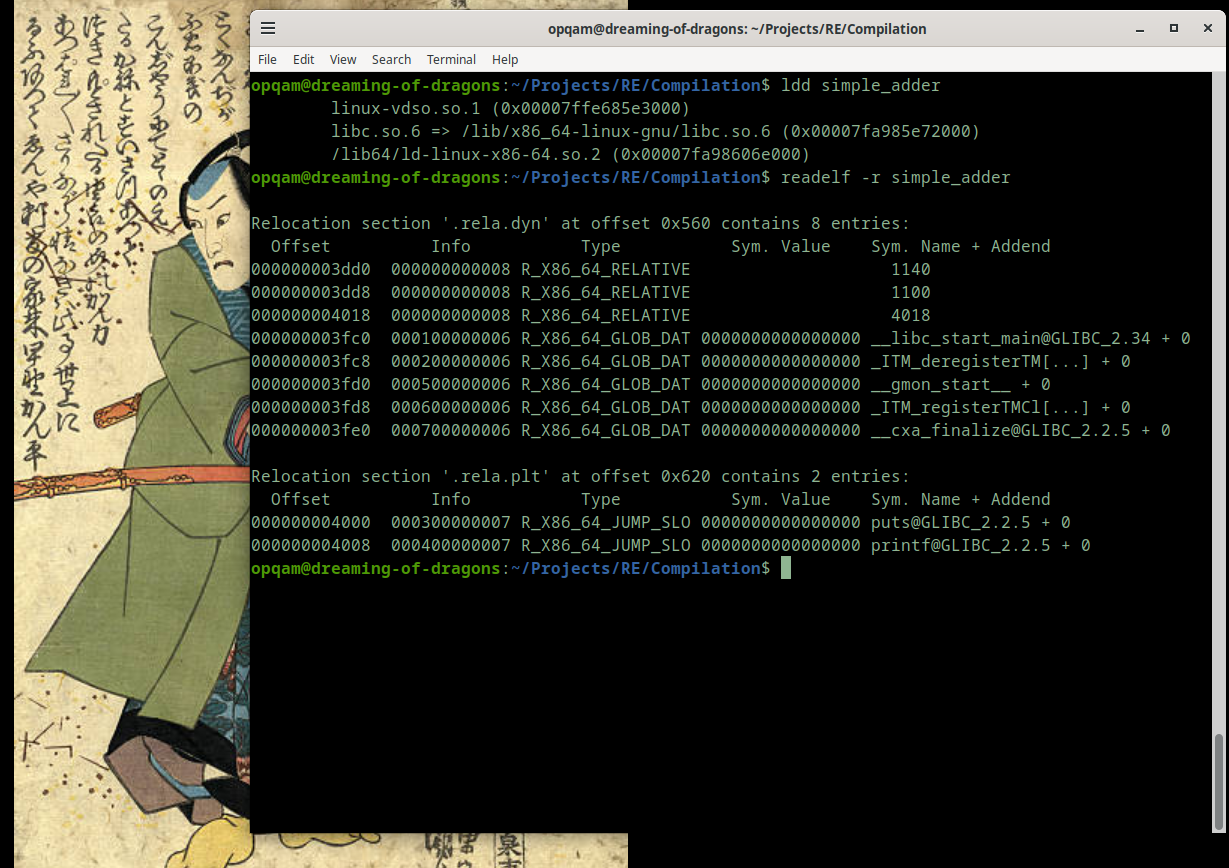
But there's more ways to inspect your ELF files. Let's look at ldd which prints shared object dependencies and use readelf with '-r' to check relocation tables:


What's all of this, you say?
With ldd we can check the shared libraries within our binary. Each listed library representing a dependency. And relocation tables are essential for adjusting addresses in a dynamically loaded binary. Entries like R_X86_64_JUMP_SLOT or R_X86_64_GLOB_DAT help resolve function calls or global variables at runtime.

There's more, of course. But this stuff is much more fun to experiment with than just to talk or write about.

Go at it. Experiment with creating your own binary files and examine them with any or all of these tools (or others). Change things, check again.


No elves were harmed in the making of this blogpost. Nor any DWARF, of course.


Saturday, November 16, 2024

Wherein We Crack Yet Another Program And Learn Something In the Process: part three (or something)


So, let's fast-forward through this first part. While it was revealing, it wasn’t all that great. Informative? Sure. Exciting? Nah.

So we can skip the fluff.


There I was, creating yet another C program to crack—asking an LLM (Large Language Model) to be rough with me. I told it to place whatever protections it found amusing, especially ones that might put a damper on my usual GDB shenanigans.

I whipped up a simple C program with some XOR gimmicks and handed it over to the LLM, telling it, “Go nuts. Protect this binary as if your life depends on it.”(I might be paraphrasing here).

The LLM's Attempt at a Challenge

Well, the LLM tried, but it failed pretty hard. Not because I’m some kind of binary-reversing wizard (I’m not), but because its defenses mostly relied on surface-level userspace tricks. These are the kinds of protections that look flashy but crumble under the weight of a determined debugger wielding carefully placed breakpoints.

Let’s cut to the chase: here’s a snippet of the original code it generated:


Breaking the "Protections"

Most of these defenses—fake functions, misleading execution flows, or basic obfuscation (not all seen here)—can be easily defeated with a debugger. When you examine the binary at runtime, these kinds of tricks are more like a speed bump than a roadblock.

GDB was enough by itself to detect the two main weaknesses—key+encrypted password:


And voilĂ , a quick peek into those memory locations reveals the key and the encrypted password. Nothing we haven’t seen before:


The logic here is straightforward. By reading the ASM, we can tell there’s a xor operation happening, and the key is being repeated (via a modulo 4 operation) to match the encrypted password’s length (10 characters).

Great! From here, undoing the operation is trivial. A simple Python script does the trick:


And that’s it. We have the password, the binary is cracked, and we move on.

Lessons Learned

What’s the moral of this part? Don’t store your bloody password and key inside your binary. Ever. Seriously, it’s like leaving your house key under the mat and hoping no one checks.


This reminds me of that guy who stored his password inside his binary while working on a GitHub project with full version control. He was surprised to find others knew the pass, regardless. 


What's Next?

I could create more complex C programs where the password lives elsewhere (maybe a server, maybe environment variables), but honestly, that defeats the purpose of this kind of exercise. Plus, it opens up a whole other can of worms I don’t feel like opening just yet.

Instead, we’ll dive into Binary Security: NX, ASLR, RELRO, Stack Canaries, and how these mitigations shape the reverse-engineering landscape.

It’ll be fun (or your money back—promise).


Sunday, October 20, 2024

Wherein We Study A Buffer Overflow And Ready Our Aim: testing the waters


Initial disclaimer: please check the link below, as it will be necessary when following along the pdf.


Hi, again! Ready for some more low-level code goodness?
Today we'll take a look at some very simple, yet purposefully flawed C programs in order to learn a bit more about buffer overflows, grasping control of the return address and disrupting a program's flow.

In the first example, we'll see that the program will result in a segmentation fault, and understand why that's happening exactly, by looking at the disassembled code under the GDB debugger. We'll then talk a little about registers, the return address, its importance, and how to grab control of it.

In the second example, we'll take a look at the basics, which will let us finally take advantage of the return address through a buffer overflow.
But, without much ado, let's jump to our first example. Remember that these two first programs are directly taken from Smashing The Stack For Fun And Profit, which you can find here (revised edition! - please follow this link to disable defenses. Alternatively check this. If you don't do this, you won't be able to take advantage of these methods).


This program is creating a char array named large_string which can take up to 256 characters, and then it's filling large_string with A's. After that's done, the program is calling a function named function, using large_string as the argument. The problem becomes immediately obvious since, as we can see, inside that function, we're filling a char array entitled buffer with our A's. But our buffer can only take in 16 characters. Ergo, we have our buffer overflow.

Function was created and its local variable buffer can only hold so many of our A's. But, since we're using strcpy, which has no control for how many values we can enter, we'll just keep on writing A's until we reach the null character (at the end of large_string).

But let's open our debugger and actually see what's happening here.


So, we're looking at main(). Can you see our loop? We're moving 'A' into eax and advancing the counter at ebp-12. A is the ASCII representation of number 41:

   0x000011ea <+50>: mov    BYTE PTR [eax],0x41

Adding +1 to our counter at ebp-0cx:
   0x000011ed <+53>: add    DWORD PTR [ebp-0xc],0x1

And comparing that value with 254 (so as to know when to end the loop):
   0x000011f1 <+57>: cmp    DWORD PTR [ebp-0xc],0xfe

When this is finally done, as I'm sure you can see, we're jumping right into our function, and this is where the fun starts. Let's disassemble it:


Please take a moment to learn what's happening here, and compare it side by side with the C code. But let us move on and actually see what's happening with our memory, as we set a breakpoint in main:


With x/32x $esp, we're checking memory position 0xffffcfa0, to which ESP is pointing, and the addresses 32 bytes above that. I won't go into much detail. You'll see soon enough what will happen when we step forward and finally reach our function breakpoint:


Looking at the memory addresses, it's obvious what happened: these locations were filled with 0x41414141 or, in plain text, AAAA.

It's important to note that the A's are being written from higher memory positions to lower ones. This is crucial because one of the last things overwritten is the return address, which will cause our segmentation fault.

As we move along, at a certain point, the return address will also be filled with A's, and at that moment we won't have a valid return address any longer. As a result, our program will suffer a segmentation fault.


And that's it. We're going nowhere fast. This program has just died on our hands. If we were trying to crack this program, we would have wanted, instead, to take control of the return address stored next to EBP. We'd use that value and point towards some other function we wanted, for example, thus altering the program's flow in our favor.

Yes, we're slowly creeping towards true shellcode. We'll get there eventually, don't worry.

But before we do that, we might as well talk about other interesting tidbits that can prove helpful when using a debugger and watching our shellcode or buffer overflow in action.

I've already shown quite a few pics, so I won't give you another one, but here's the very first function that appears in our "Smashing the Stack" doc. It's pretty simple, but it hopefully shines a light on the function we've been analyzing so far:


void function(int a, int b, int c) {

char buffer1[5];

char buffer2[10];

}

void main() {

function(1,2,3);

}


If we look at the memory locations, as we did before with the other program, we'll see:

0xffffd09c: 0x00000000 0xf7ffcff4         0x0000002c 0x00000000
0xffffd0ac: 0xffffdfc0         0xf7fc7550 0x00000000 0xf7da2a4f
0xffffd0bc: 0xffffd0e8 0x565561e5 0x00000001 0x00000002
0xffffd0cc: 0x00000003 0xffffd110         0xf7fc1688 0xf7fc1b60
0xffffd0dc: 0x00000000 0xffffd100 0xf7fa2ff4 0x00000000
0xffffd0ec: 0xf7da92d5 0x00000000 0x00000070 0xf7ffcff4
0xffffd0fc:         0xf7da92d5 0x00000001 0xffffd1b4 0xffffd1bc
0xffffd10c: 0xffffd120 0xf7fa2ff4 0x565561b6 0x00000001

I have put in bold important addresses and their contents. In order, from left to right, going down...

ESP

  • Points to the current top of the stack.
  • At 0xffffd09c (the lowest memory address in this snapshot)
  • ESP is showing the exact spot in memory where new data are pushed onto the stack

Saved EBP

  • At 0xffffd0bc
  • The base pointer of the caller function
  • This marks the base of the previous stack frame before the current function was called

Return Address

  • At 0xffffd0c0
  • This is the address the program will jump back to after the current function completes
  • overwriting this location with a malicious address can cause the program to "return" to an arbitrary memory location

Variables

  • Just below the saved EBP and return address are the local variables and parameters
  • At 0xffffd0c4 (0x00000001), 0xffffd0c8 (0x00000002) and 0xffffd0cc (0x00000003)

Buffer

  • Just below these local variables we can see the space that has been assigned to our buffer1 and buffer2 local variables
  • It's not 5+10 bytes in size. Instead, because of padding and alignment, it will be 8+12 bytes in size, for a total of 20 bytes.
---

Next up: We'll learn how to control the return address and force the program to do our bidding. This will set the stage for mastering the art of shellcoding! 

Saturday, October 5, 2024

Wherein We Crack A Simple Program: level 1


I'll let you in on a little secret: I don't play chess.
Well... I can, and I have, but I don't anymore.
Not because I lack the ability, but because I get obsessed with it. I mean it.

Let me paint you a picture.

Years ago, I decided to rekindle my childhood passion for chess. As a kid, I was pretty good—not grandmaster level, mind you, but good enough to hold my own (and beat up quite a few adults in the process). 

Fast forward to adulthood, and I downloaded a chess app with daily challenges. You know the type—"Checkmate in X moves." Innocent enough, right? Wrong.

I was immediately hooked. Every spare moment became a chess moment. One day, I hopped on the subway, intending to get off 15 minutes later. When I finally looked up from my phone, I was at the end of the line, having totally missed my stop. "No big deal," you might think. Except I did it again. And again. Six or seven times that day, I rode back and forth, missing my stop each time, completely absorbed in the game.

That's why I can't play chess casually. It's all or nothing for me - books, constant practice, moves (and countermoves) consuming my every waking thought. So, I made a promise to myself: chess would only be for teaching my daughter the game. Nothing more.


Now, you might wonder where I'm going with this. Well, it's simple, really. Back when I was 12 or 13, if I couldn't find a partner, I'd play against myself. Hard to imagine in today's world of one-click online matches, but it wasn't half bad.

So, in that same spirit of playing against oneself (and a Woody Allen quote does come to mind...), I am starting a new series of blog posts where I'll be cracking simple programs. I'll create C programs that require a password to jump to the next level, then attempt to crack them by disassembling the binary and reading it with ASM. Each success will lead to a stronger, harder-to-crack program.

Feel free to spice things up by asking an LLM to create these for you, or better yet, challenge a friend to send you increasingly difficult C programs (remember? Real friends know C).

Here's the program (ignore it and move on if you want to just check the steps taken).


Simplicity itself. The program has a fixed password in plain text. If anything, this one is screaming FIND ME. Right?

Still, always remember that time, days, months, or years ago, when this simple password would be a deterrent enough to keep you from accessing the program.

Let's look at four different ways to find out this password. You might even be considering a fifth: some sort of brute force attack. But this would probably fail in this case. Notice that the password has 16 characters and, a priori, we have no present way to know how many characters it has. It's also not incredibly likely that the password will be in a popular wordlist.

So, assuming that, and assuming that you're only testing for some 60 total characters (uppercase + lowercase + a few favorite symbols), it could take up to 60 to the power of 16 attempts for our loop to capture the correct password. That's a lot. That's really a loooooooooot. So let's not do that.

Our four approaches (remember to man <tool>):

  • xxd


See the password?

xxd is a tool that converts binary files into their hexadecimal representation, which basically gives us a byte-by-byte view of the file.

If the program is storing the password in plain text, like in this case, then... it's Game Over for the program, and Game On for us.


  • strings


This nice tool quickly pulls out readable strings from a binary file. Nifty, no?

Our poor, exposed password is there again, for all to see.

Even if you don't see something as glaringly obvious as a password, taking a look at visible text can give you some good hints on what the program might be doing.


  • ltrace


After having played through the
Leviathan game in OTW, I became a fan of this tool. ltrace is a powerful tool that traces all the function calls made by a running program - allowing us to spy on what's happening under the hood as the program executes. More so, since there is absolutely no obfuscation in our original C program.


  • gdb


This one is starting to feel like an old friend, right?

I won't go into much detail on how to use it, since I've done so here and here.

After exploring we find something slightly odd:

A couple of movabs instructions (this is intel flavor right here. Is it also there if we don't use intel? Check it out)


Now, movabs is an instruction that moves a 64-bit (8-byte) immediate value directly into a 64-bit register. That's interesting, since we use movabs when we 
need to load a large constant value that won't fit in the 32-bit immediate field of a regular mov instruction.

Our registers will be loaded with those values in reverse-order (because of little-endian). And, just to make it plainly obvious (you could do this outside, through a program, etc) we can showcase what we mean:


There we go. Our hexadecimals converted into characters, in all their glory.


Alright. Program cracked with 4 different tools. But this is just our opening move. We're moving on to the next level. 

Whatever was your weapon of choice, we got this result:


Next up:

  • Basic Obfuscation of the Password
  • Environment Variables


Consider Phlebas, who was once handsome and tall as you.

Sunday, September 8, 2024

Wherein We Get Lost And Compare Object Dumps: C vs. Assembly


That's a rabbit hole, Alice. And those are books on shelves, all the way down.


Hi again!

I created a simple "Hello, World!" program in C, so that we could have a quick talk about function prologues and epilogues in Assembly, but we're in for a detour, as happens with all rabbit holes. 

And the truth is that it's just rabbit holes as we're going down (until we reach elephants, and then it's turtles all the way down, of course).

Here's the culprit:

Ok, nothing impressive, but it does its job.


After compiling this program through the usual steps, the program runs and prints "Hello, World!" to the standard output.

Next, I wanted to create an Assembly program that would print the exact same line, and although I can read some Assembly and am making progress in that front, I can't (yet) write my own Assembly programs. So I asked our LLM friend to do it for us. And so it did:


Pretty neat.

And we can turn this into a binary file with:
nasm -f elf32 print_hello_ASM.asm -o print_hello_ASM.o


And then turn it into an actual program with:
ld -m elf_i386 print_hello_ASM.o -o print_hello_ASM

And voila! We can run this program just like with our C program...

But...

 "wait, wait, wait, wait!"
You say.

"What's with the turning-the-code-into-binary-and-then-into-a-program-magic?

We don't need to compile stuff in Assembly, like we do with C?"

Well, those are great questions!

The thing is that we take compilation for granted. In fact, compilation is done in 4 steps:

- Preprocessing

- Compilation

- Assembling

- Linking

Let's ask an LLM to give us a little more information on these steps, and let it assume we want it explained in a simple manner:


Confused? Remember that you can always ask it to explain again from a different angle, in simpler terms, through analogy, etc:


We can always check more trustworthy sources, check documentation, forums, etc, like in:
https://unstop.com/blog/compilation-in-c

(I told you, it's rabbit holes most of the way down)


I'm not going to give you an in-depth explanation of these concepts (that's your job, really). But let's just say for the sake of simplicity, that when we compile our C code, we're in fact going through these four steps, and that when turning our Assembly code into a program, we just take the two last steps: Assembling and Linking (also, fyi: note that these steps can be combined or optimized in modern compilers).


To showcase the difference between these two processes and the baggage that comes along with C, let's look at an objdump of both our C and our Assembly programs.

What's an objdump? Here:


So... it's basically when we take a binary file and disassemble it back into Assembly code (+ extra info).


Then let's jump into that Assembly objdump of ours, right? Here:


And, for comparison, here's a gif with the C objdump:


Notice any difference? The C objdump file is a tad longer.
And note that I haven't included all the possible information in these dumps (checkout the man page for objdump. In particular for the -s argument).


Notice, though, that there is something we haven't seen before in our little Assembly forays. In that ASM objdump, we see these "int   0x80" lines. What are these?
Seems important enough.

These are system call interrupts, which are a way for our program to request services from the operating system's kernel. Namely, we want to be able to print our Hello World message on screen and we also want to be able to exit our program - that's what those two syscalls are doing there.

This is done behind the scenes through compilation when we're using C - so it's not all that obvious to us.


More info from our friendly LLMs:


Ah, but I just recalled that we were meant to discuss function prologues and epilogues in Assembly.

I went to https://godbolt.org/ and placed my original C code in there, and immediately got an Assembly representation of that code as well. 

And lo and behold, it's even color-coded, allowing us to see exactly what is the prologue and what is the epilogue.

Here:


But I'm leaving function prologues and epilogues for an upcoming blog post.


In the meanwhile, you can always check that yourself if you're curious. Or anything, really. See something you don't understand? Leave no stone unturned! Jump into that hole, satiate your curiosity and keep learning.


Wednesday, September 4, 2024

Wherein We Discover Some C Code: With A Little Help From Our Friends


 For the past year, while studying networking and programming in ATEC, I kept ChatGPT constantly open—not to give me direct answers, but to engage in a kind of "learning dialogue," let's say. It was there to challenge my understanding of the topics I was learning and to quickly fill in knowledge gaps that came along.

Was I skeptical of its knowledge? Of course. The same way I’m skeptical about any single source of information—take Wikipedia, for example. When it first came out, it was vilified by many for its crowdsourced approach to knowledge. But, hey! We still use it to this day. It’s a great tool, right?


Step 1: Generate and Compile the C Code

Continuing from our previous blog entry, let’s once again use ChatGPT to help us learn a bit more about Assembly and low-level code.

Today, we’re asking ChatGPT to give us a simple C snippet, which we promise not to read. We’ll copy and paste it into a document and compile that document into a binary, which we will then disassemble and try to understand.

Sounds fun? Let’s go!

See that? No peeking. Just copy that code, paste it, and save the script so we can compile it.

Our ask was simple: no recursion (no need to add an extra layer of complexity), only one function, etc (you can read it for yourself).

Copy-paste that sucker into an empty file, and that's it!
You didn't peek. You have no idea what's in that file. The world still makes sense.

If you are a "dirty cheater", just ask a friend to send you something very simple. Hey, it's a great way to make friends. True friends know C.

Next, you'll want to compile that code without debugging symbols. You might need to install the necessary multi-lib support:

sudo apt-get install gcc-multilib g++-multilib

"Oh, but I'm using Red Hat/Arch (btw)/etc, how do I get that package installed?"

Well, just ask ChatGPT. That's what it's there for. Or Google it, or something.

Let us (finally) compile that code:

gcc -m32 -o my_file my_file.c

I'm going to compile a second version with debugging symbols, by adding -g (remember?). More on this later.

Step 2: Disassemble and Explore the Assembly Code

Now we jump into gdb, like we did last time, but with a small twist: we'll be checking out TUI - the Text User Interface, by typing:

(gdb) layout asm


I might be biased, but this looks totally cool.


I'm not going to go deeply into the function prologue and epilogue (I'll leave that for another blog entry). Right now we're just interested in the "meat" of the program. What is it actually doing?

Notice that, right before the call line where we're calling a function named compute we're actually loading the value 4 and pushing that onto the stack?

That value is being loaded into the function as an argument.

That's useful to know!

And here it is, the compute function in all it's glory:


Again, we'll skip all the setup and concentrate on the "actions".

Look at that add. We're taking eax, which you might have noticed is now holding the value 4, and adding to itself, literally doubling that value. And we have another addition further on. We're adding 5 to that value, right before leaving our function and returning to main.

Let's cut this story short.

If you look at main, you'll see that our function will then print the result and end the program.

Like I said: we'll get to the tasty bits another day, but I wanted you to have a view of what we can do with this stuff. How we can use ChatGPT to create simple challenges which we can then work on. Remember: don't know something? Ask it what it means. Ask it to explain from a different angle. Ask it to draw you a picture - literally.


Step 3: Create your own C version of that disassembled code

Let's do it. We're not trying to be perfect here. Only to grasp the idea behind the assembly code and create a C program that could achieve a similar result. And here it is:


Is this perfect? Nah. Far from it. But it gets the gist of what that Assembly code is doing. And that's good enough for now.


Step 4: Now even more TUI

Remember when I said that I was going to create an extra compiled version of the original code? One that kept the debugging symbols.

Let's open that file in gdb, and after we've entered TUI, we'll also write:

Would you look at that? Because we added debugging symbols to our compiled code, we can now use TUI to read both the disassembled code and the original C code. How cool is that?

Oh, right. Notice that the original code doesn't have result+= result? Again, details.

For now, we're pretty satisfied with the result we got.

Next time, we'll be checking another really cool tool—one that is online and that doesn't require any installation or compilation. You just present the code, and it will return you corresponding assembly output.

I hope this was informative and gave you some ideas on how to use an LLM in your learning process. It can help you achieve these small goals competently and in an expedite manner.


Happy disassembling!


"INTs Aren't Integers and FLOATs aren't Real"

                                     I was told this is a cat-submarine. Tail = Periscope. I believe it.   Over the past few weeks, I’ve be...